


At Venngage, infographics, statistics, and data visualization are kind of our thing. We’ve written infographic guides and created hundreds of infographic templates that anyone can edit with just a few clicks.
We know how impactful, engaging, and interesting infographics can be–especially in our fast-paced and increasingly visual world.
In fact, infographics are about 30x more likely to be read than a full article.
We also know they also can be used in almost any industry, from marketers to real estate agents and even HR professionals. With an infographic you can easily summarize a blog post, create an helpful fact sheet for your employees or break down a complicated process that someone can consume in a matter of seconds.
But it doesn’t matter that we know all of this information, if no one else does.
That’s why we decided to round up 20+ of the best infographic statistics and visual content facts, as well as some of our best infographic examples.
So if you need to convince yourself or your boss to start creating more infographics, you’re in the right place.
Let’s get into it!
20+ infographic statistics and facts for 2026
Visual content has never been more important as we fight for the attention of our users and followers. Infographics are extremely useful content for brands who want to stand out in 2026.
Plus, as you will see below in the various infographic statistics, they are extremely popular with marketers and creators.
1. 28% of marketers used interactive infographics in their campaigns
Interactive infographics are still not the default format, but they are gaining traction. Nearly one in three marketers reported using interactive infographics in 2025, showing growing interest in visuals that go beyond static charts and layouts.
This suggests that teams are experimenting with formats that encourage active engagement, especially for explaining complex data or guiding users through layered information. As tools make interaction easier to implement, adoption is likely to grow in 2026.
Key takeaway: Interactive infographics are moving from niche to practical, especially for data-heavy content.
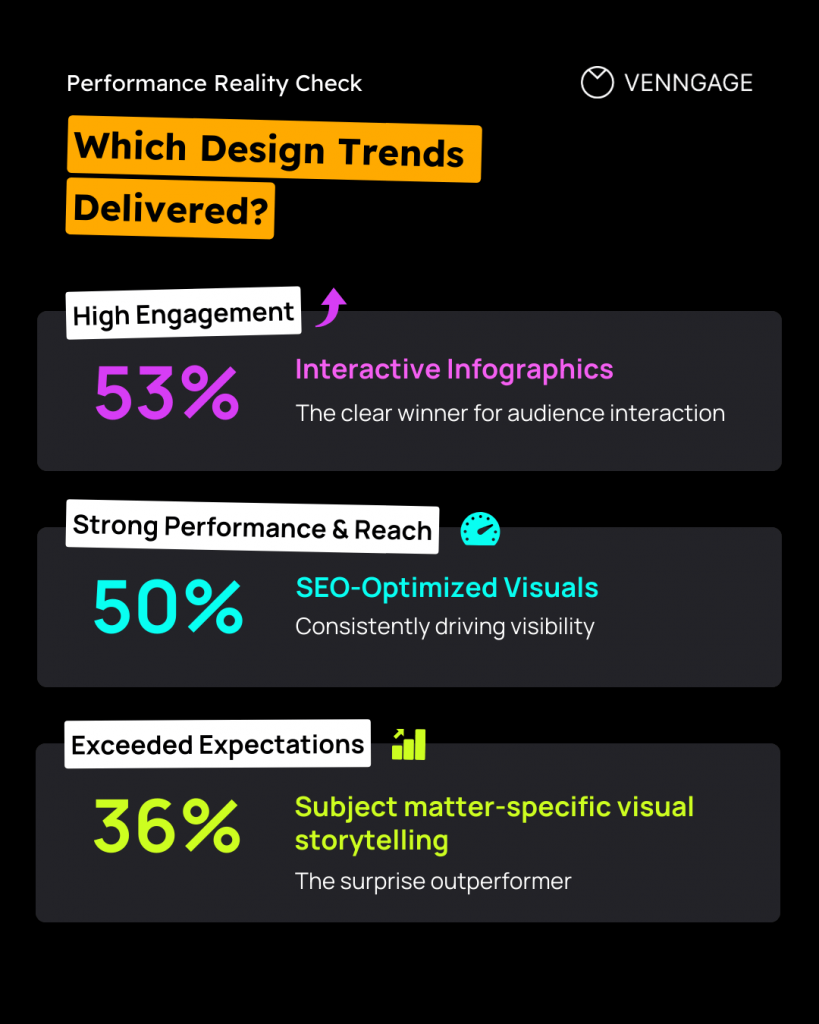
2. 53% of interactive infographic users saw strong engagement
Among marketers who used interactive infographics, more than half reported strong interactions such as comments, likes, and shares. This indicates that when interactivity is used, it tends to perform well rather than going unnoticed.
The gap between adoption (28%) and effectiveness (53%) suggests untapped potential. Many teams have not tried interactive infographics yet, but those that do often see meaningful engagement gains.
Key takeaway: Interactive infographics may be underused, but they deliver strong results when applied thoughtfully.
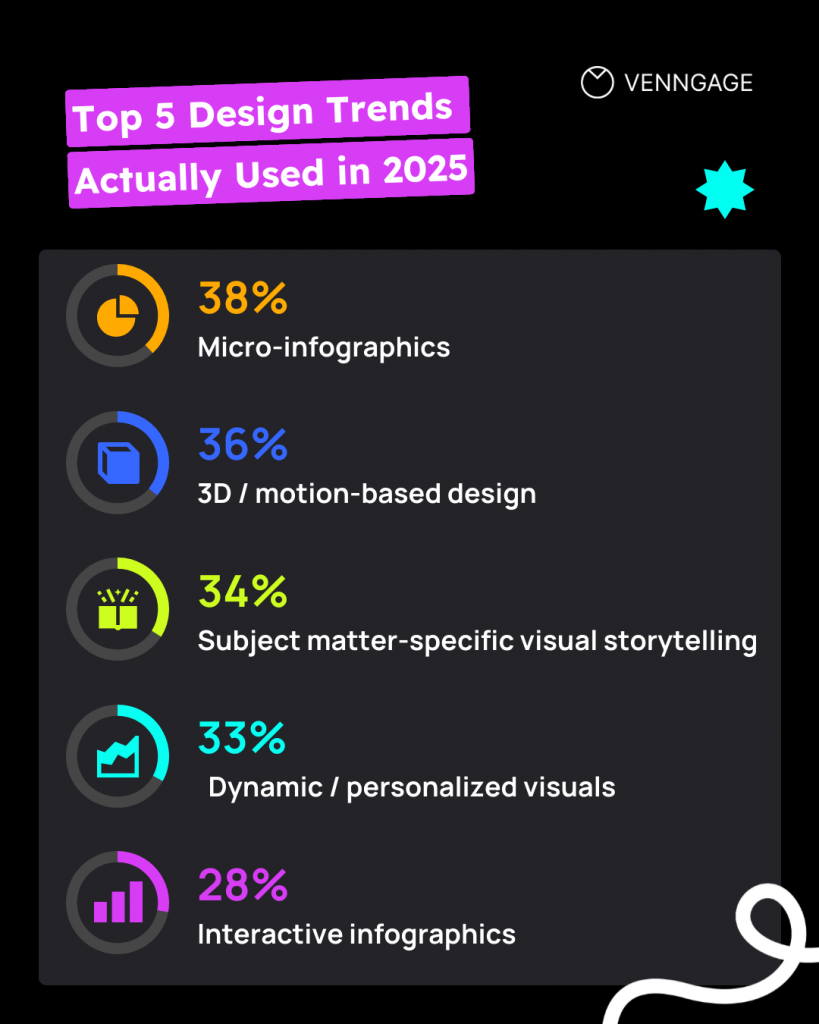
3. 38% of marketers used micro-infographics for social media
Micro-infographics — short, snackable visuals designed for social feeds — were used by more than a third of respondents. These formats are well suited for platforms like LinkedIn and Instagram, where audiences scroll quickly and favor clear, focused visuals.
The rise of micro-infographics reflects a shift away from long, one-page designs toward modular visuals that can be reused across channels.
Key takeaway: Infographics are becoming more social-first and modular in format.
4. 37% of users found micro-infographics effective
Among those who used micro-infographics, 37% reported them as effective for driving reach, impressions, and clicks. While not universal, this shows that bite-sized infographic formats can perform well when aligned with platform behavior.
Effectiveness depends on clarity and relevance. Micro-infographics work best when they communicate a single idea or data point quickly, without relying on long explanations.
Key takeaway: Micro-infographics can deliver results, especially when designed for fast consumption.
5. 34% used or planned to use subject-matter-specific infographics
About a third of respondents reported using or planning to use infographics tailored to specific topics or domains. These visuals also received positive audience feedback, including praise and constructive responses.
This highlights a shift away from generic infographic templates toward more context-aware designs that reflect industry knowledge and audience needs.
Key takeaway: Specialized, topic-driven infographics resonate more than one-size-fits-all visuals.
6. 22% of bloggers create infographics as part of their content mix
While infographics are not the most common content format among bloggers, about 22% of bloggers include them in their content strategy. This places infographics in line with other formats like roundups — showing that they are still considered a useful tool in the broader landscape of content types, even if less dominant than how-to articles or list formats.
Key takeaway: Infographics have carved out a meaningful niche in content strategies.
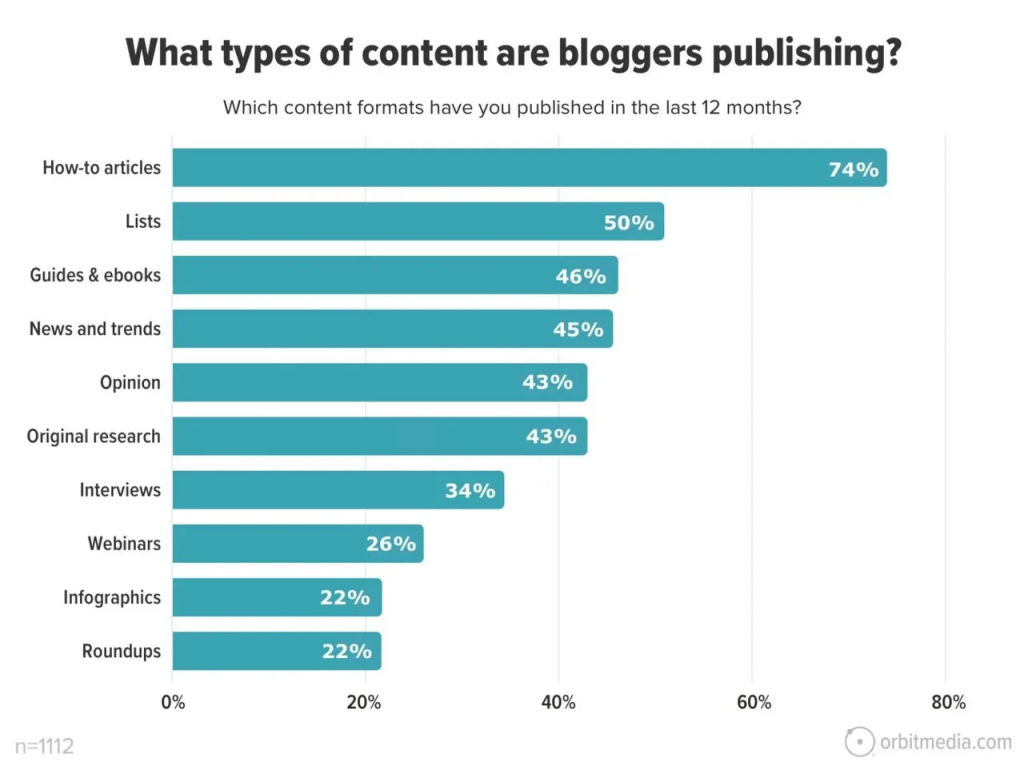
Source: Content Marketing Institute
7. Infographics have a large positive effect on academic achievement
A quantitative meta-analysis of 12 empirical studies on use of infographics in education found that infographics had a large, significant positive effect on academic achievement compared with traditional instructional approaches.
This means when students or learners were exposed to infographics as part of instruction, their learning outcomes showed substantial improvement.
Key takeaway: When designed well, infographics can significantly enhance knowledge gain and comprehension.
8. Infographics can increase website traffic by up to 12%
Study by DemandSage tells that websites that use infographics can see up to a 12% increase in traffic compared to those that rely only on text-based content. This is largely because infographics make complex information easier to scan, understand, and share, which helps attract and retain visitors.
Infographics also tend to earn more backlinks and social shares than standard blog posts. When visuals are embedded in articles and optimized properly, they can improve time on page and referral traffic, contributing to overall visibility and discoverability.
For example, a big reasons our graphic design trends article gets so many mentions, views, and links is because we take the time to create a unique infographic each year:
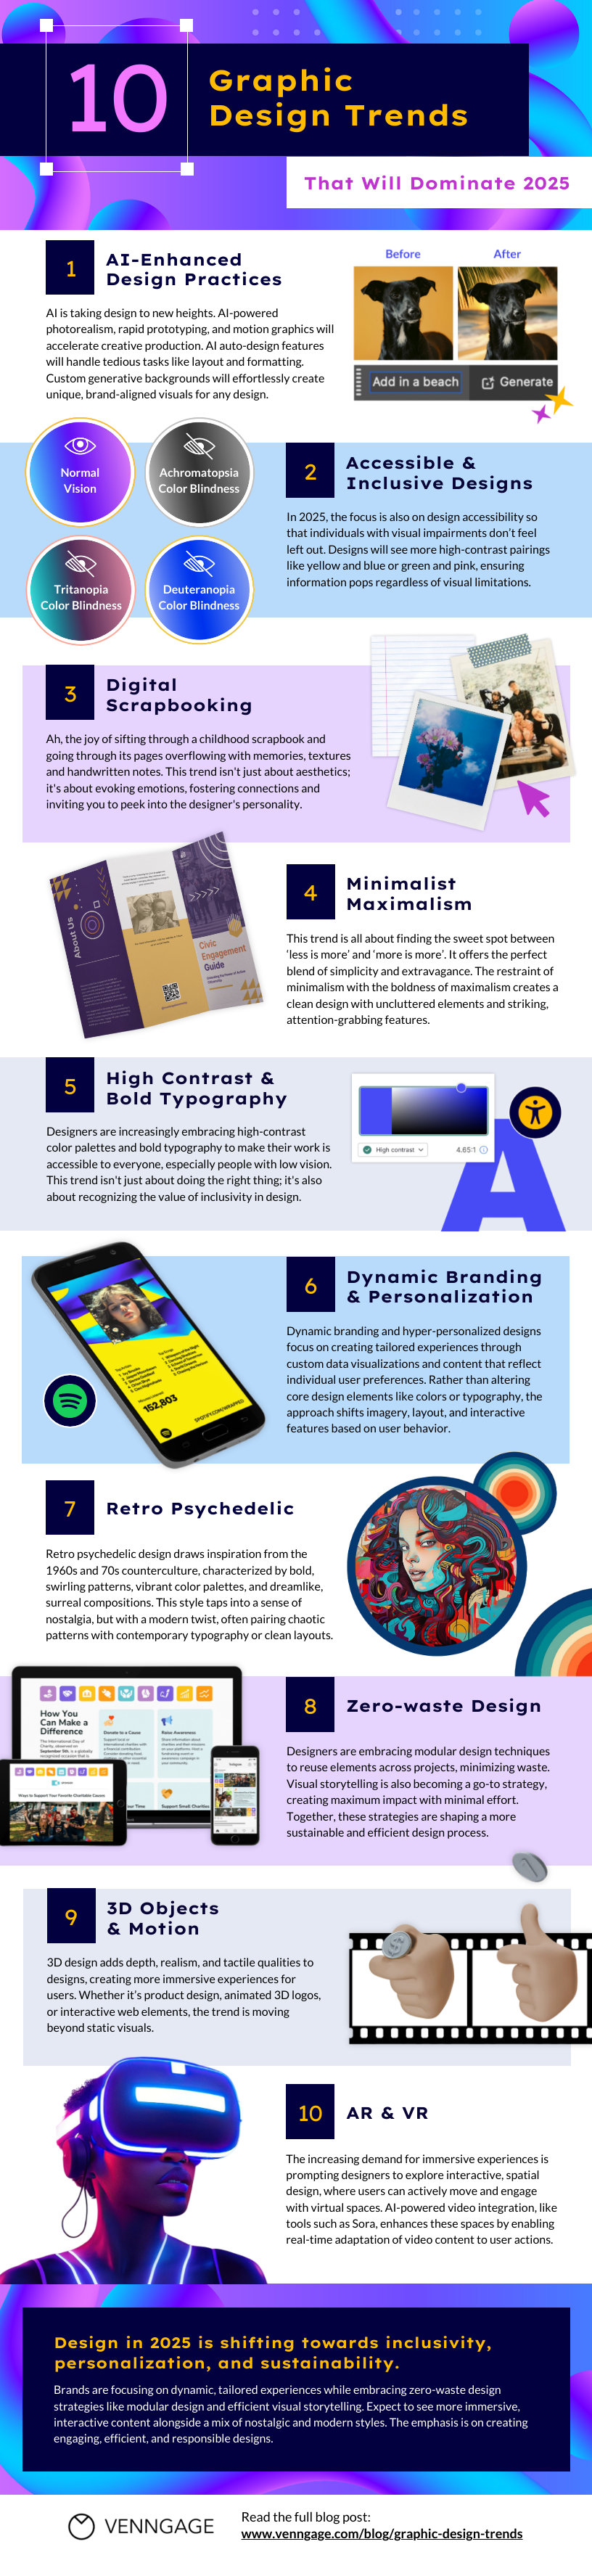
Key takeaway: Infographics don’t just support content, they can directly contribute to measurable traffic growth when used strategically.
9. Infographics improve comprehension and retention
Research published in SAGE Journals tells that visual representations enable quicker comprehension and better retention of scientific information compared to traditional text-based descriptions. Graphical abstracts (GA) and infographics (IG) help readers process complex ideas more efficiently by reducing cognitive load and presenting relationships visually rather than through dense text.
This makes them particularly effective for summarizing research findings, where speed of understanding and recall are critical.
Key takeaway: Infographics help people understand and remember complex information more effectively than text alone.
10. Articles with infographics attract more attention and engagement online
Studies cited in the article show that research articles featuring graphical abstracts or infographics receive higher click-through rates, longer page view times, and more social media shares than articles without them. These interaction metrics indicate stronger initial interest and deeper engagement.
Key takeaway: Infographics can increase engagement and influence how widely research is cited.
11. Infographics help make complex scientific information accessible to non-experts
Graphical abstracts and infographics make complex research easier to engage with by reframing technical information in a visual form. This helps non-specialist audiences grasp ideas that would otherwise remain confined to academic literature.
This is especially important in fields like medicine and environmental science.
Key takeaway: Infographics expand the reach of scientific information beyond experts to the general public.
12. Infographics can improve communication of surveillance data for decision-making
MDPI Healthcare study on infection prevention and control found that using infographics to share surveillance data made complex clinical information easier to understand and engage with. Nurses involved in the study reported that infographics simplified data, improved accessibility, and helped teams better grasp key findings that might otherwise be buried in long text reports.
Key takeaway: Infographics can enhance the clarity and usefulness of critical data in professional settings, helping translate complex findings into actionable insights.
13. Infographics see an average click-through rate of 2.00%, with 37% of clicks going to the first link
The average click-through rate (CTR) for infographics is 2.00%, which signals strong user intent compared to many standard display and content formats. This suggests that readers don’t just scan infographics passively — they often take action after engaging with them.
In fact, nearly 37% of users click on the first link within an infographic, showing that placement and visual hierarchy matter. When links are integrated naturally into the visual flow, infographics can effectively guide attention and drive clicks.
Key takeaway: Infographics can drive meaningful user action, especially when links are clearly positioned and aligned with the visual narrative.
14. Articles with infographics got 178% more links than standard articles
Articles that include infographics receive 178% more inbound links compared to text-only articles. This highlights how infographics make content more link-worthy, especially when they present original data, clear explanations, or visual summaries that other publishers want to reference.
Key takeaway: Infographics significantly increase link acquisition, making them a powerful format for SEO and content distribution.

15. 72% of B2B buyers prefer infographics early in the purchasing process
A strong majority of B2B consumers say they prefer infographics during the early stages of their buying journey. At this point, buyers are usually trying to understand a problem, compare options, or get up to speed quickly, rather than evaluate detailed product specs.
Infographics work well here because they simplify complex information, highlight key differences, and help buyers orient themselves without requiring a deep time commitment. This makes them especially effective for awareness and consideration-stage content.
Key takeaway: Infographics are most impactful at the top of the funnel, when B2B buyers want clarity before depth.
16. Only 49% of marketers create their own infographics or visual content
Less than half of marketers say they actively create their own infographics or visual assets. This indicates that while visuals are widely used, many teams still rely on stock graphics, templates, or externally sourced visuals rather than producing original designs in-house.
This gap often comes down to time, design resources, or confidence in visual creation. As visual content becomes more important for differentiation and clarity, this statistic highlights an opportunity for teams to invest in tools and workflows that make infographic creation more accessible.
Key takeaway: Visual content is valued, but original infographic creation is still a barrier for many marketing teams.
17. 42.22% of marketers say original graphics are among the visual types they use most often
Source: Venngage
In Venngage’s survey of 105 marketers, 42.22% said original graphics were one of the visual formats they used most frequently (alongside charts/data visualizations, stock photos, videos, and presentations).
This is a useful signal for infographic strategy because “original graphics” typically includes assets like infographics, illustrations, and custom charts. It also reinforces a broader shift away from default visuals toward more branded, made-for-purpose graphics that feel specific to the message.
Key takeaway: A meaningful share of marketers are actively choosing original graphics as a digital marketing trend over generic visuals, which supports the case for investing in infographics and custom chart design.
18. Articles featuring infographics received 72% more views than normal articles
Articles that include infographics see 72% more views compared to articles without visual data elements. This indicates that infographics help attract attention early, encouraging more people to click through and engage with the content.
Infographics also make articles easier to scan and understand, which can improve visibility across search and social channels. When visuals clearly support the topic, they can act as an entry point that draws readers into the rest of the content.
Key takeaway: Infographics significantly boost content visibility by increasing the likelihood that people will view and engage with an article.
Let’s be honest, would you rather read a 2000 word article, or quickly read this infographic about presentations tips and get about the same amount of information.

19. Infographics are 30x more likely to be read from top to bottom than blog posts or articles
Unlike long-form text, infographics are designed for visual flow, guiding readers through information in a structured and intuitive way.
This makes them especially effective for communicating data, processes, or multi-step ideas where context matters. Readers are more likely to follow the entire narrative when information is presented visually rather than scanning or dropping off partway through.
Key takeaway: Infographics encourage complete consumption, making them ideal for conveying full stories, insights, or explanations without losing reader attention.
20. 69% of marketers say visual content is either very important or absolutely necessary in their marketing strategies
A strong majority of marketers say visual content is either very important or absolutely necessary to their marketing strategy. This reflects how central visuals have become for communicating ideas quickly, standing out in crowded channels, and supporting different stages of the customer journey.
Key takeaway: Visual content is no longer optional. Most marketers see it as a core requirement for effective communication.

21. 56% of marketers say that they use a visual or infographic in almost every piece of published content
More than half of marketers say they include a visual or infographic in nearly every piece of published content. That signals how visuals have become the default, not the add-on, especially when attention spans are short and content is consumed quickly across feeds and search.
Key takeaway: Visuals and infographics are now part of the baseline for content publishing.
22. 55% of marketers produce social media graphics more than any other visual content
Social media graphics are the most frequently produced visual format for marketers, with 55% prioritizing them over other visuals. That tracks with where most brands spend time distributing content and where performance is easiest to measure.
For infographics, this also hints at why “micro-infographics” work. Marketers are already building for social, so infographic-style content that fits feed behavior tends to be easier to adopt and ship consistently.
Key takeaway: Social-first visuals dominate production, which makes social-friendly infographic formats a practical win.

If you want to learn how to make an infographic I would recommend starting here:

How to Make an Infographic in 5 Steps
Now if you are in search of some more stats and data, check out this article:


