


Reports may not be the most exciting communication format. But they’re important.
To make smart decisions about budgeting, marketing strategies, product development and growth strategies, you can’t rely on gut feeling alone.
And if you’re trying to sway stakeholders, creating a report with a simple, elegant design and creative data visualizations is guaranteed to impress.
This guide will deliver the most essential business report templates you can edit with Venngage, plus design tips and best practices.
What is a business report?
A business report is a document that delivers important information about a company’s performance, financial health, a particular project, or other aspects that influence its decision-making process.
Business reports come in various formats, such as PowerPoint presentations and online dashboards, offering more than just traditional files and spreadsheets.
They are crucial for organizations as they provide vital details that guide decision-making for business owners and managers.
They act as GPS, highlighting essential aspects like customer satisfaction, operational efficiency, and financial figures. Business reports serve different audiences and purposes, delivering information in a clear and engaging format for both internal and external stakeholders.
Want a quick rundown of some of the business report templates in this blog? Check out this video tutorial:
1. Annual Report
An annual report is an all-encompassing document that allows you to reflect on your company’s past year, including:
- Your company’s mission statement
- Your company’s growth (financially, product-wise, culture-wise)
- Your statement of income and cash flow
- Your various business segments
- Information about the company’s directors and executive officers
- Information about your company’s stock and dividends
- Wins and success stories
A lot of that sounds pretty dry, doesn’t it?
There’s actually a lot to be excited about in that list. You’re talking about how your company has grown, your wins (and maybe a few losses), and what’s on the horizon for the coming year.
You can bring that story to life in your annual report design and we have business report samples to inspire you.
This annual business report example uses a variety of charts and unique sections like “program highlights” to tell the agency’s story:

Think about how you can represent your company visually:
- Are there photos you can include of your business in action?
- What fonts and colors reflect your business’s personality?
- Are there icons you can use to illustrate certain concepts?
The below annual report design uses an energizing orange and yellow color scheme and cute icons. The format is highly visual and modern. All this reflects a dynamic company that’s optimistic about the future.
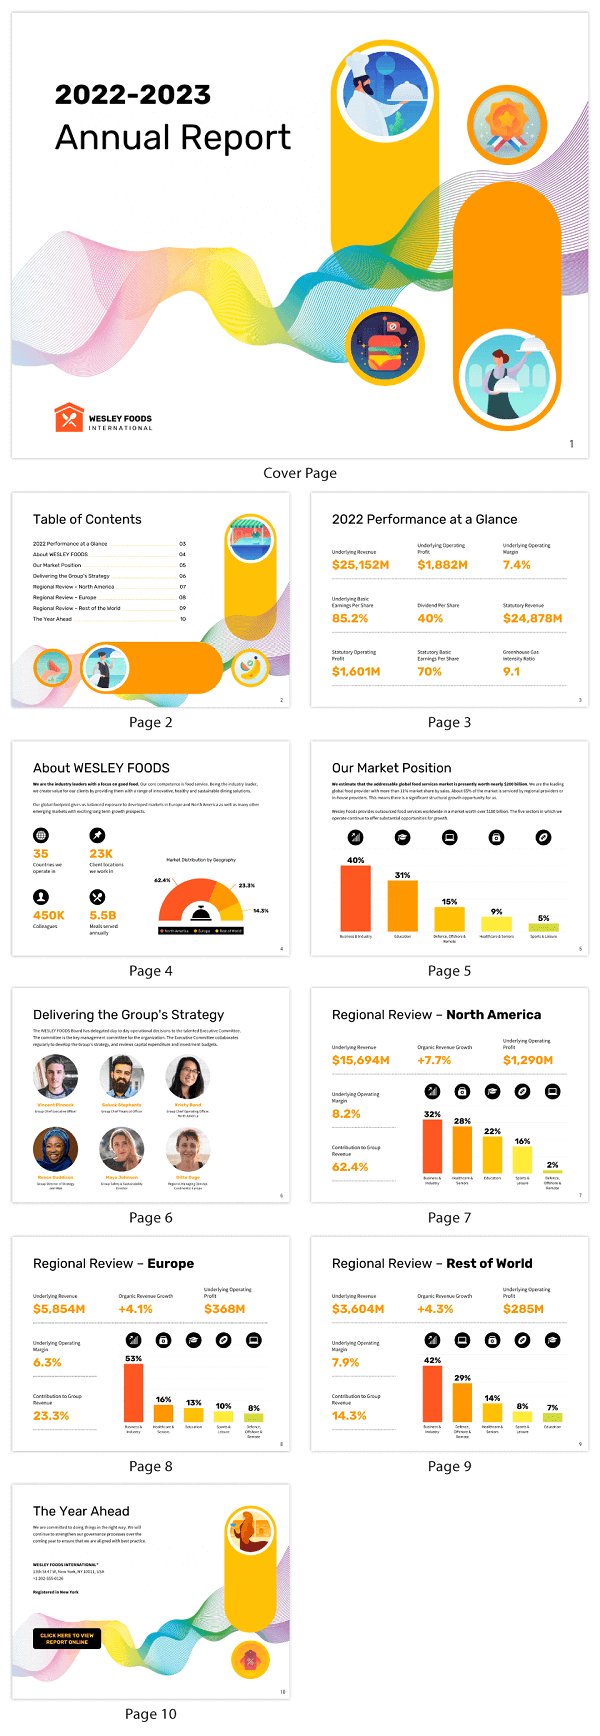
This company annual report template uses a mountain motif to reflect the company’s ambitious goals. Take a look at how the different sections of the report (“Strategy”, “Finance” and “Performance”) are color-coded to make the report easier to scan:

In the business report example below, the sleek, modern design with bold color accents reflects design trends in the games industry, which would appeal to stakeholders.

The same design ideas can be applied to an annual report presentation.
Take this annual report presentation for a coffee shop company. The whole design reflects the coziness of a coffee shop, from the softly filtered photos to the old-fashioned font:

A few annual report best practices:
- Create an eye-catching cover for your report.
- Tell your company’s story in your annual report design by using thematic visuals, like background images and icons.
- Pick a decorative font for headers and pair it with a more minimalist font for body text.
- Look for opportunities to visualize data using infographics, charts and pictograms.
2. Project Status Report
Communication is central in any project. Consultants, agencies and freelancers especially want to be as transparent as possible. That is why a project status report template is one of the business report examples we are sharing in the article.
A project status report is crucial for communicating updates on what you’ve accomplished and what’s still pending. It also helps you flag any issues, either current or on the horizon. This helps build trust with the client.
The project status report template below communicates key information in an easy-to-understand format.
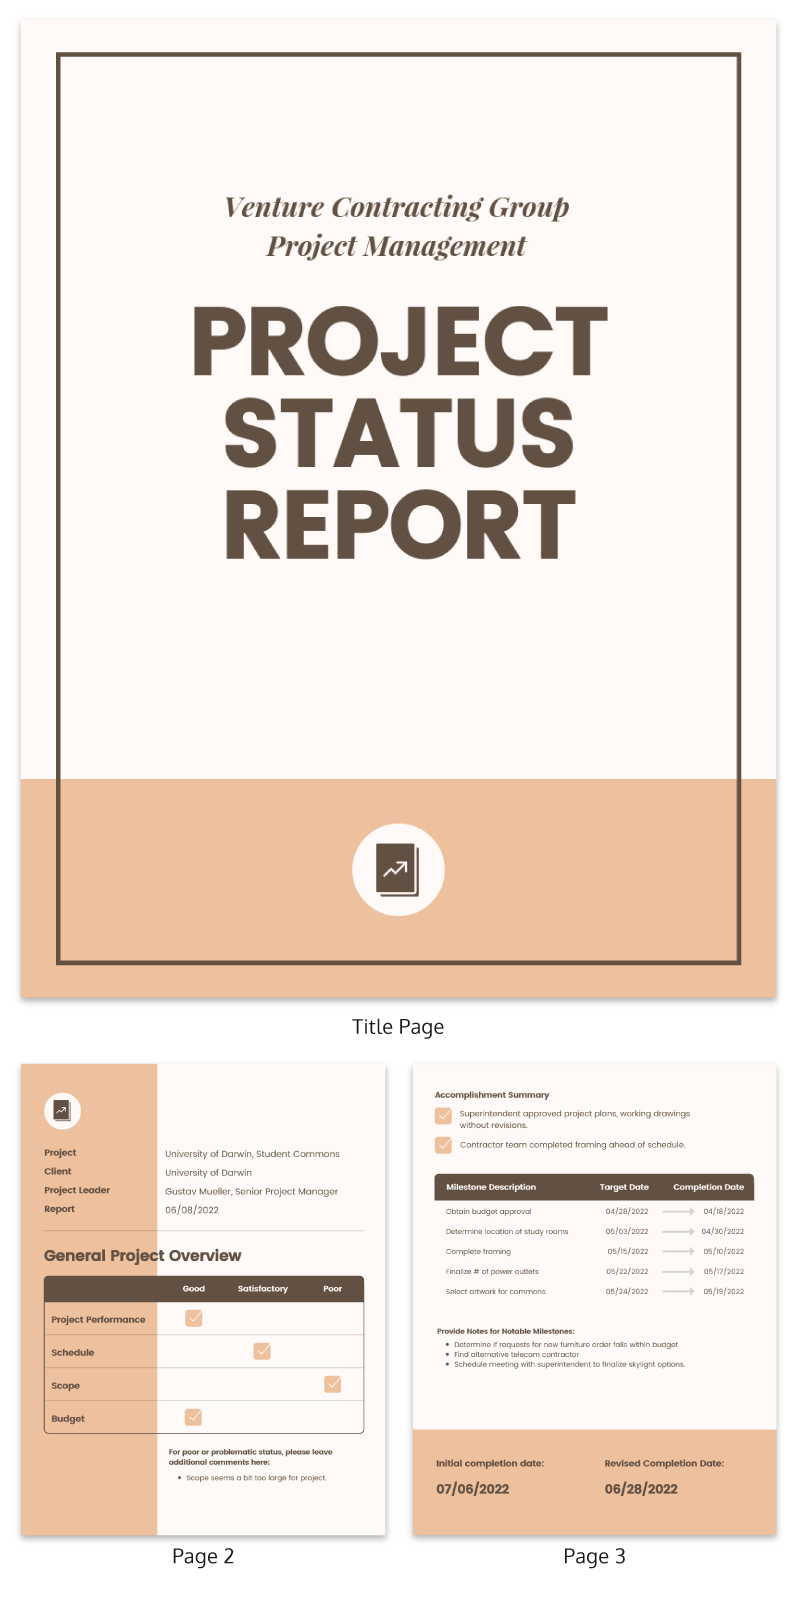
The above template lets you alert the client if the project is:
- Suffering from budget or scope creep
- On track in terms of schedule
- Healthy or not i.e. milestones completed on schedule, issues resolved
You can add bullet points on the second page to quickly flag key issues that are impacting project success.
Related: Our post on how to write a project management plan.
Simple Project Status Report
Avoid ad-hoc emails or meetings. Use a simple project status report template to present your latest work and keep everyone on the same page, without endless back and forth.

The project status report below would work well for weekly updates.
This progress report template lets you quickly provide an overview to busy stakeholders, who’ll be able to spot key project issues and progress at a glance.

Project Status PPT
Big updates might require consultants to communicate the status of a project in person. The below presentation template uses charts and data visualization to get your key points across immediately.
Clients or other stakeholders can see what’s been accomplished and when, while the last slide leaves room for what’s still pending.

A few project status report best practices:
- Include a summary of all important tasks currently in progress. If you have a weekly meeting with the client, this section will probably serve as the jumping-off point for your conversation.
- Stakeholders should be able to tell at a glance if the project is way off schedule or there are too many unresolved issues.
- Document all outstanding problems and concerns. It’s important to have a record in case you run into issues with the client later on.
Related: Our post with 30+ project plan examples plus design tips.
3. Budget Report
Budget reports are like the GPS for your business finances, guiding you with a clear picture of where you are compared to where you planned to be. They show the actual expenses and revenues alongside your budgeted numbers, highlighting any detours or opportunities for savings. These reports are crucial because they help you make smart decisions, ensure you use resources wisely and pivot on strategy when needed.
A budget report typically breaks down:
- The different categories of your budget
- The last year or quarter’s spending for each category of your budget
- Areas where you may need to cut or increase spending
- Forecasts for the coming year or quarter
Business Monthly Expenses
A full budget report is a bit too dense to pass around a room during a meeting.
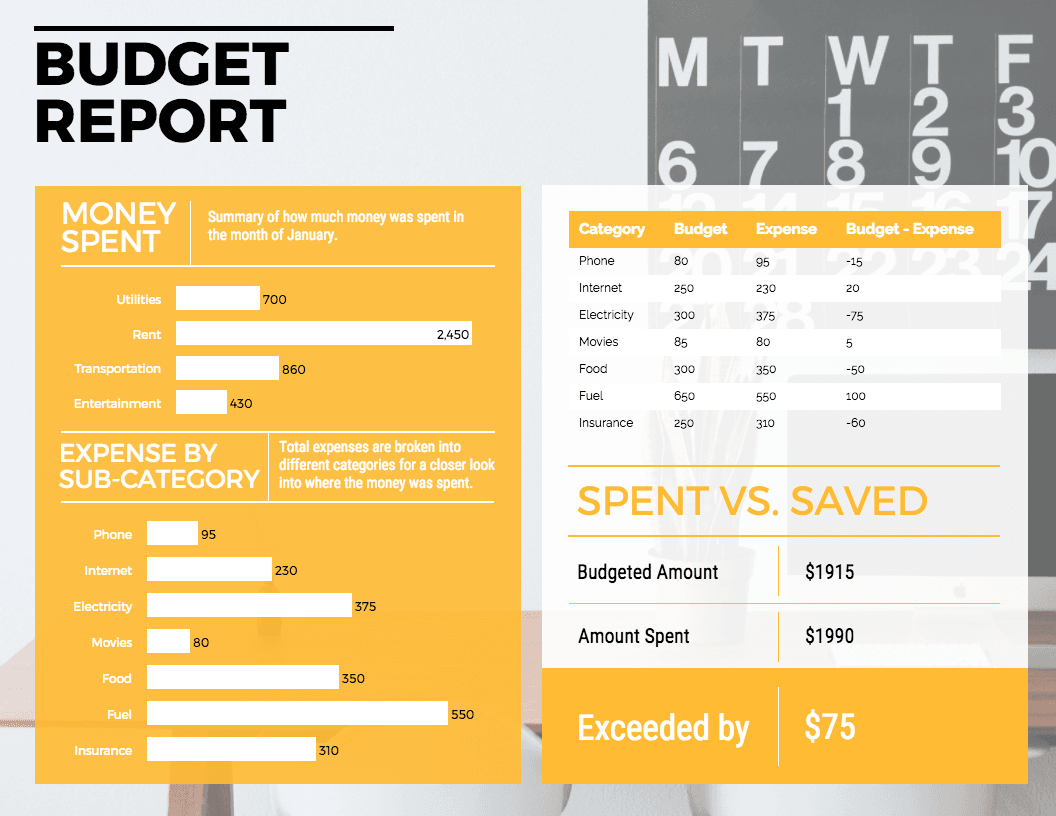
But, a visually engaging presentation or one-page summary, like the business report example below, is perfect for keeping your team and stakeholders up to speed.

You can provide an overview of the last period’s spending by category, and highlight the amount you saved or exceeded the budget by.
For example, take a look at this summary budget report slide that uses a thematic background image to make it more engaging:
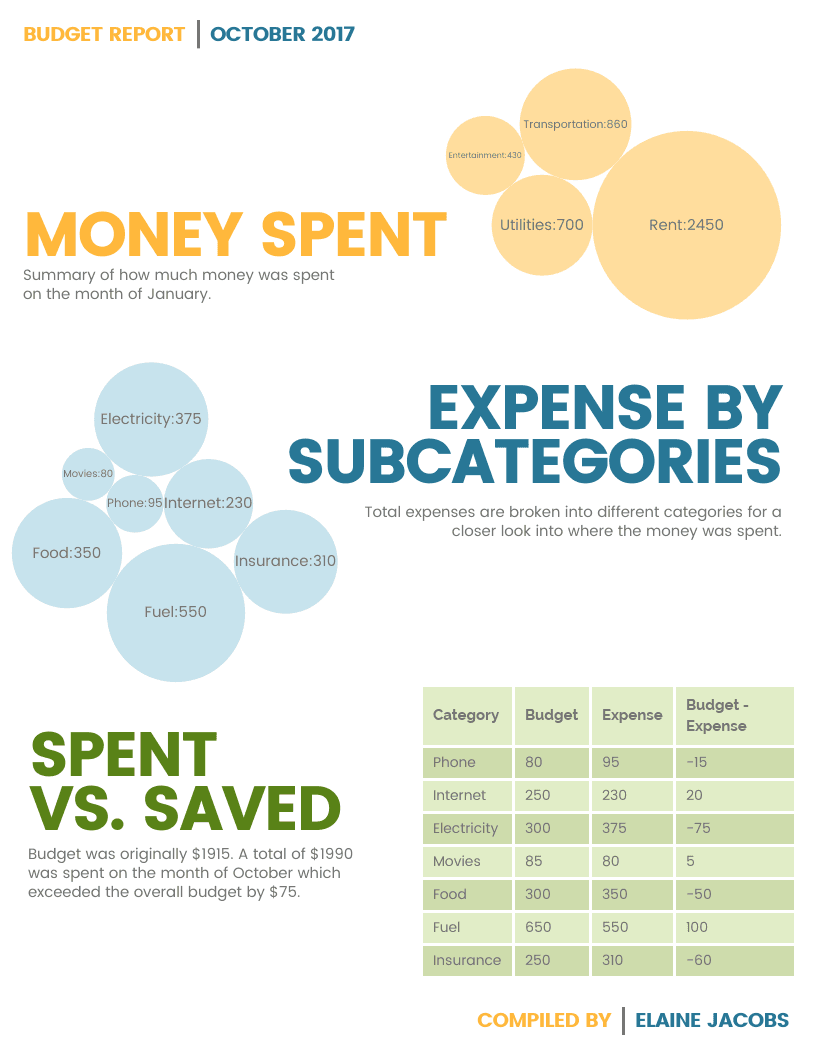
A quick summary page is also the perfect opportunity to creatively visualize data.
While tables are certainly efficient for comparing amounts spent, you could also use a more unusual visual like a bubble chart. This is because unique visuals make memorable business report examples.
Forecast Budget
A forecast is an essential business report that shows where a business is headed financially. It’s not a plan for the future, but rather its current short-term direction.
Use this forecast template to project your businesses’ revenue, and take appropriate action.

A few budget report best practices:
- Clearly label the period the report covers (monthly, quarterly, yearly)
- Provide a brief description of each section of your report, to highlight important insights
- Use a table to compare amounts of money saved vs. spent
- Use bar charts, pie charts and bubble charts to visualize budget allotment
- Highlight important insights using contrasting colors, bold fonts and icons
For more inspiration, take a look at additional financial report examples that break down complex numbers into clear, meaningful insights.
4. Sales Report
If you aren’t tracking your sales on a weekly, monthly, quarterly and yearly basis, it’s time to start.
Creating a sales report for different time periods can help you identify trends, as well as an opportunity for growth. Regularly reporting on your sales can also help your team stay focused on your goals.
What should be included in a sales report?
A sales report typically covers any of the following data:
- An overview of sales goals and whether or not those goals are being met
- Revenue and expenses
- Sales forecasts for the upcoming periods (month, quarter, year)
- Products and services that are selling the most and ones that are lagging
- Number of leads and conversion rates for a given period
- Any challenges or roadblocks
Weekly sales report template
Consider making sales reporting a segment of your weekly team meetings. You may want to provide a quick update for company-wide meetings and a more in-depth report for sales and marketing team meetings.
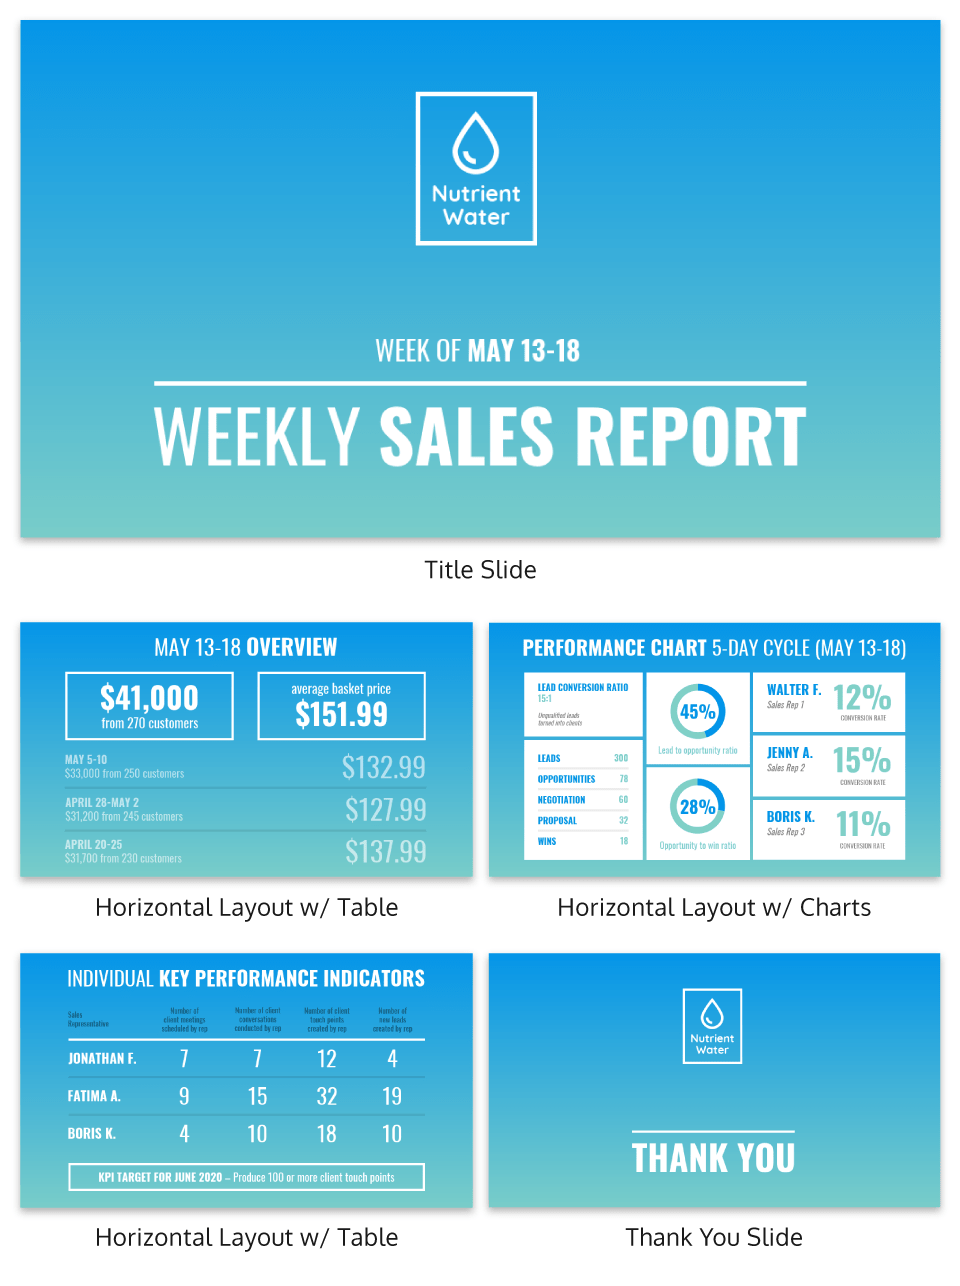
Here’s an example of what a quick weekly sales report could look like:

The slide simply covers the total sales for the week and compares them to previous weeks to highlight growth.
While this sales report presentation digs deeper into KPIs (key performance indicators) and conversions:
Monthly sales report template
For a monthly, quarterly or yearly sales report, you will probably want to go more in-depth into your metrics as you plan for upcoming periods.
That said, you don’t want to produce a 62-page text-heavy document no one will read. Surprise your client or boss with a fresh new way of doing things that are engaging and concise. You’ll differentiate yourself as an innovator.
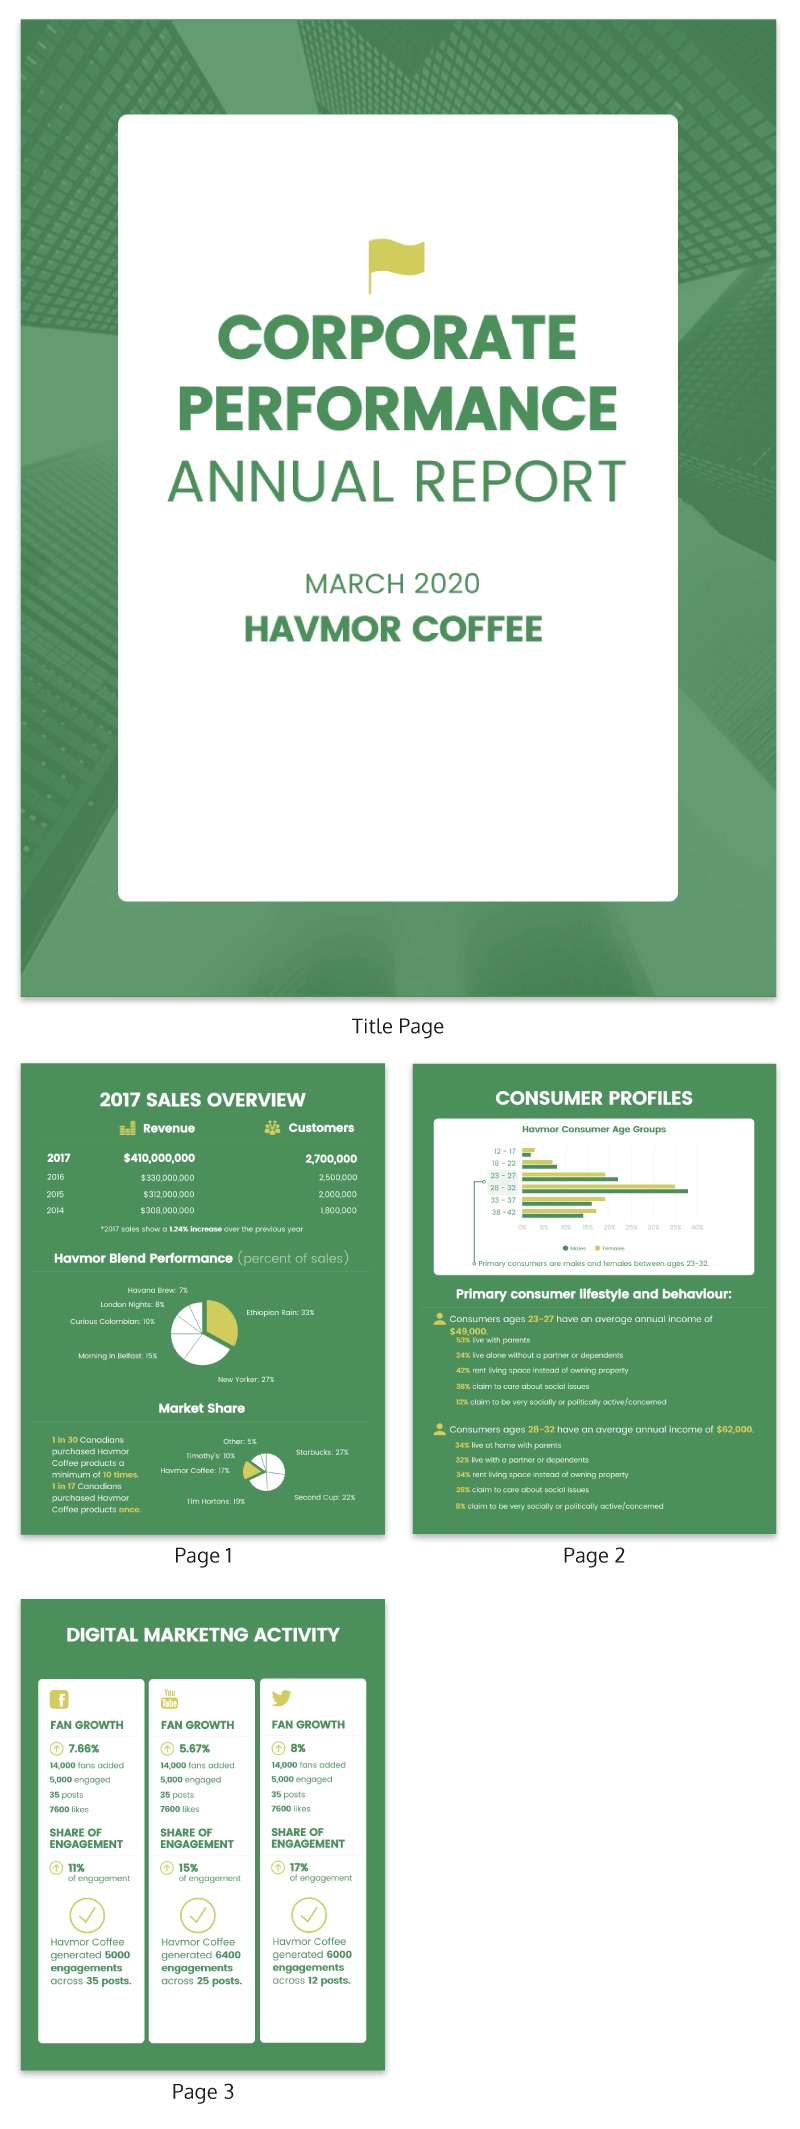
For example, the following monthly sales report template uses a variety of charts and tables to keep the data fresh:

The below sales report template will help you visualize key sales metrics using pie charts, bar graphs and tables. The weighted text and icons help organize information in an easily digestible way.
Making your sales report easily accessible will help build your reputation as someone who’s transparent and trustworthy.
A few sales report best practices:
- Clearly identify the time period you are reporting on
- Use descriptive section headers and include descriptions for any charts or tables that need more clarification
- Provide context for readers, explain any major trends they should be aware of, any challenges your team encountered, and how the goals have been impacted
- Use line charts and bar graphs to show changes over time and highlight trends
- Emphasize key metrics in big, choose bold fonts (for example, the total sales for a given week)
- Use contrasting colors to emphasize keywords or one point on a graph
For more inspiration, explore more sales report examples to see how different teams present their data and highlight key insights.
5. Digital Marketing
If you’re a SaaS or e-commerce business, I don’t have to tell you how important digital marketing is. It’s the thing that can make or break many small businesses.
In order to scale and grow your business, it’s important to make informed, deliberate digital marketing decisions.
That means always looking for ways to improve your search rankings, grow your social media engagement, and optimize your ad campaigns.
A ‘digital marketing report’ is a pretty broad term for a report that could be an overview of all your digital marketing channels or one particular channel.
A digital marketing report that covers all your main marketing channels could include any (or all) of the following data:
- An overview of your current digital marketing strategy
- Your main marketing goals and whether or not they are being met
- An overview of your conversion metrics, including the number of leads, paid vs. organic leads, and your cost per conversion
- An overview of your traffic metrics, organized by channel
- An SEO overview, including any changes in rankings for target keywords
- An overview of PPC campaigns you’re running, including clickthrough rate, ROI and cost per click
- An overview of your social media channels, including engagement metrics and leads from specific channels
For example, take a look at this digital marketing report template that dedicates one page to each channel. Note how the company’s branding has also been incorporated into the design by using the brand’s colors and visuals that reflect the computer theme:

In a digital marketing report that focuses on one specific marketing channel, you will probably want to go more in-depth into each metric.
For example, in a social media report, you should cover:
- A comparison of your performance on specific social media channels like Facebook, Twitter and YouTube (you could try visualizing it with a comparison infographic)
- Specific engagement metrics like impressions, clicks, subscriber count, likes and comments
- An overview of your followers, including demographic information like age, gender and profession
- Conversion metrics from each specific social media channel
The below social media report visualizes some of these key metrics.
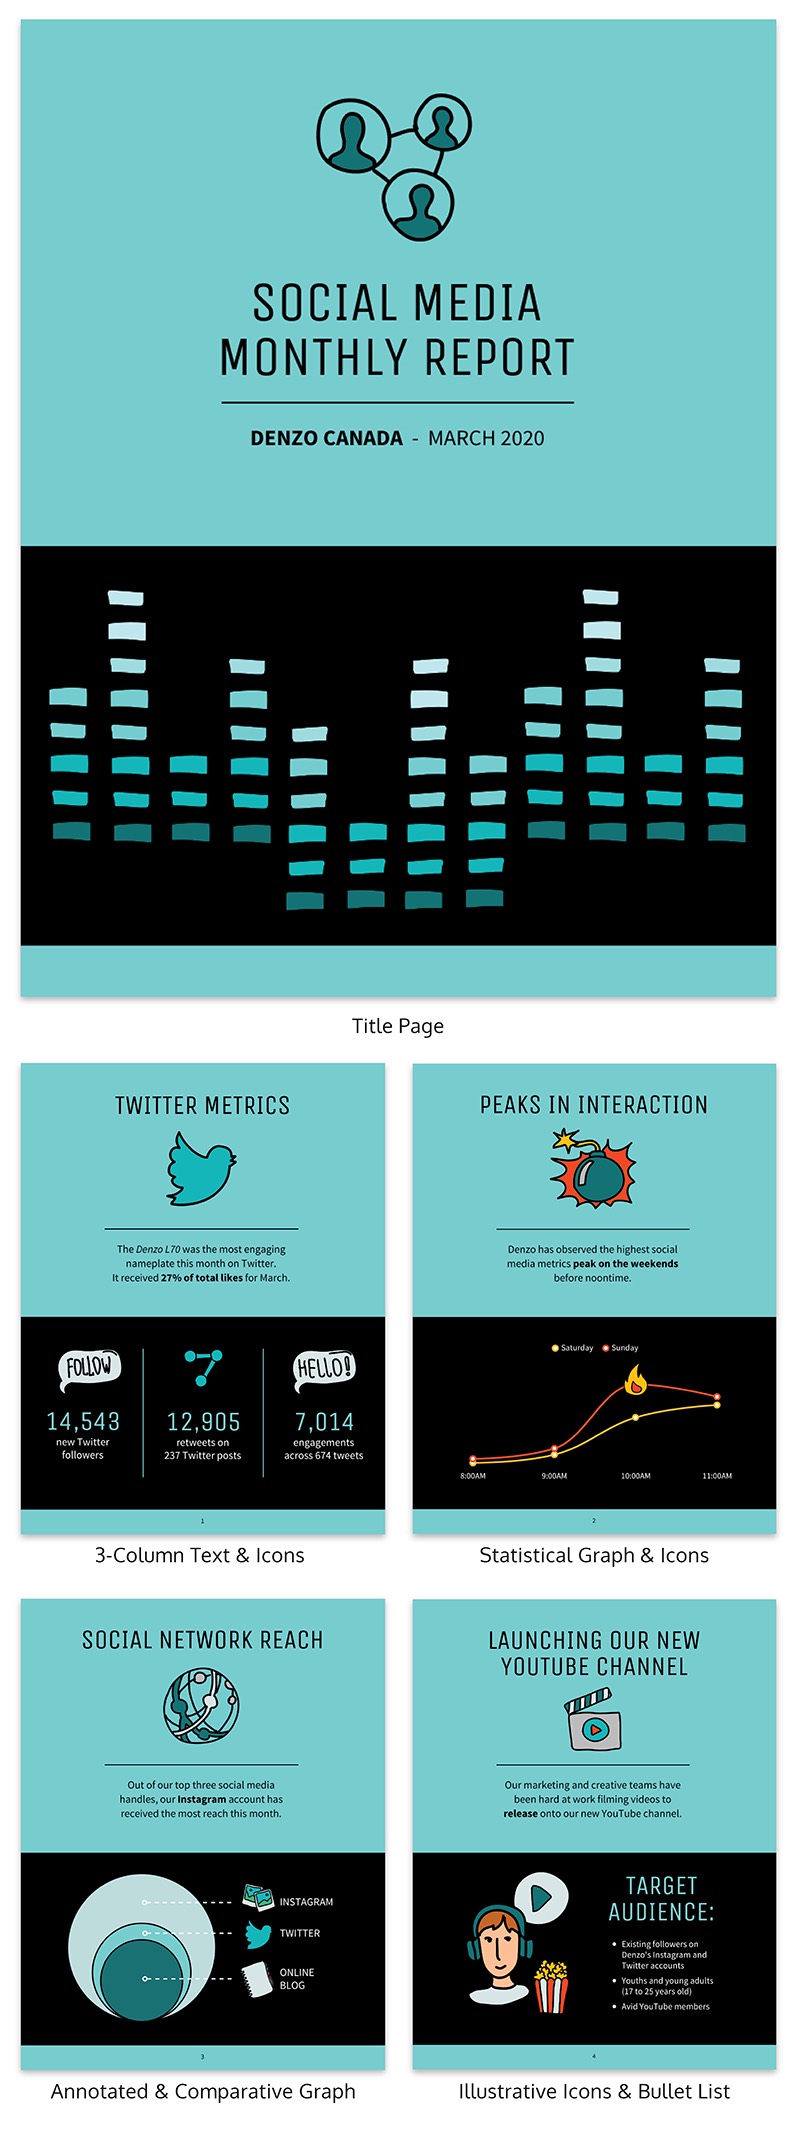
As a consultant, you may be gifted in social media marketing but totally flummoxed by all things design. Look better than you are by using the above template. It’ll help you present your findings in a way that’s effective and professional, while still managing to be playful and engaging.
If you’re concerned about organizing information by channel, here’s an example of a social media marketing report presentation that uses colored columns to make it easy to scan for a specific channel’s metrics:

A few digital marketing report best practices:
- Provide an overview of the performance of all your channels, or a particular channel
- Organize your report by channel (“Organic Search”, “Social Media”, “PPC”) or by specific campaigns/projects
- If your report is long enough, include a table of content to make it easier for readers to navigate your report
- Use bar charts and tables to compare your performance on different marketing channels
- Use icons to emphasize key information and visualize different channels (for example, different social media networks)
- Try to communicate your information concisely and focus on only one topic per page or slide
Related: Our post on what is a marketing plan and how to write and design one for maximum effectiveness.
6. Competitor Analysis
Get the attention of marketers with a competitor analysis report. The best reports show exactly what a company must face off (and beat) to be successful.
A competitor analysis report usually has the following sections:
- Product summary
- Competitor strengths and weaknesses
- Competitor strategies and objectives
- Outlook: is the market growing? Flat? Splintering into niche segments?
The following competitor analysis template neatly organizes these categories into compact sections and highlights important stats. Stakeholders can quickly compare them with their own company’s numbers and get an immediate sense of how they measure up.

Using a pre-designed competitor analysis template is also a great idea for consultants who want to set themselves apart from big consulting firms or boutiques. Visualizing data is a way to set yourself apart as numbers-focused, unique and innovative, as in this business report example.

A few competitor analysis report best practices:
- If you’re listing all competitors, add those entering the market in the next year as well as indirect competitors who sell to the same customers as yours.
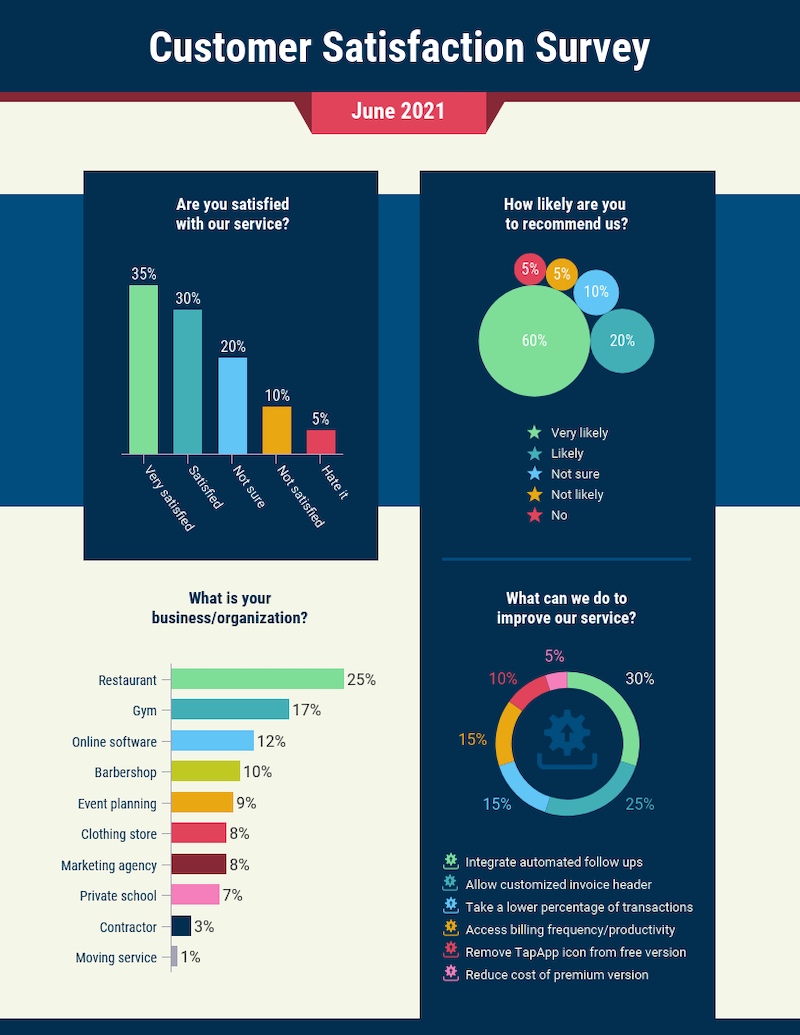
- Find customer satisfaction surveys for competitors (usually carried out by trade press) and include their findings.
- Talk to the sales department to get a sense of the competitor’s customers.
- Do informal research on the competitor’s strengths and weaknesses. Talk to journalists who cover this specific industry. Don’t just rely on online information.
Related: Our post on how to create a competitor analysis report (with templates).
7. Case Study
One of the business report examples on our list is the business case study. Though not a report exactly, a case study analyzes a particular aspect of a company or a situation it faced. A consultant may need to write one as part of a corporate training program they’re developing.
Case studies usually focus on one of these situations:
- Startup or early-stage venture
- Merger, joint venture, acquisition
- Market entry or expansion
- New project or product
- Pricing optimization
- Profitability
- Industry landscape
- Growth strategy
What makes case studies unique is how they tell a story. They include background information on the company, a protagonist or key players, the situation and outcomes.
The below case study template has plenty of space for this narrative while using icons and numbers to highlight key details.

Make sure to include a conclusion that contains your key findings. Why did the protagonist make the decisions she made? What were the outcomes? What can we learn from this? Circle back to the key question the case study raises and answer it.
Business case study
Business case studies are usually teaching tools to show how real companies approached a particular scenario or problem. The case study usually reflects a business theory and demonstrates its real-life application.
For example, the following business case study template shows how a crafts retailer uses earned media to drive engagement-heavy traffic.

This is another version of the above case study. Notice the changes in branding in this business report example that sets it apart from the previous template.

Marketing case study
Case studies are a powerful form of marketing as they show a potential customer how existing customers are already using your product or service to meet their goals.
For example, this social media marketing case study illustrates how Toy Crates used content marketing to radically increase their sales:

A few case study best practices:
- Outline any constraints and challenges the protagonist of the case study faced that affected her decision (such as a tight deadline).
- Attach supporting documentation, such as financial statements.
- Include an original title, such as “Design Thinking and Innovation at Apple.” The title should mention the company and the subject of the case study.
Related: Our post on how to write and design a case study.
8. Growth Strategy
Setting goals for your business might seem easy in theory… but setting ambitious yet realistic goals can actually be quite challenging.
At Venngage, we follow these 5 steps to set our goals:
- Identifying and set high-level goals.
- Understand which inputs and outputs impact those goals.
- Run experiments to impact those inputs.
- Validate those experiments.
- Foster accountability for the results within the team.
For a more in-depth look at this process read our growth strategy guide.
For example, if you’re a SaaS company, your high-level goals would probably be a specific number for revenue, a number of daily active users or employee count, like in the business report template below:

Once you’ve identified your high-level goals, the next step is to identify your OKRs (Objective Key Results), the metrics that impact your goals. Generally, you will probably want to break down your OKRs by channel.
So, if one of your goals is to hit a certain number of daily active users, your OKRs could be organized by:
- Acquisition OKRs, like organic traffic and paid traffic
- Conversion OKRs, like conversion rate
- Retention OKRs, like retention rate
Once you’ve identified your OKRs, you can come up with experiments to run that will impact those OKRs.
At Venngage, we use a weekly sprint to plan, execute and analyze our growth experiments. But I know other companies that use longer sprints, like two-week or month-long sprints.
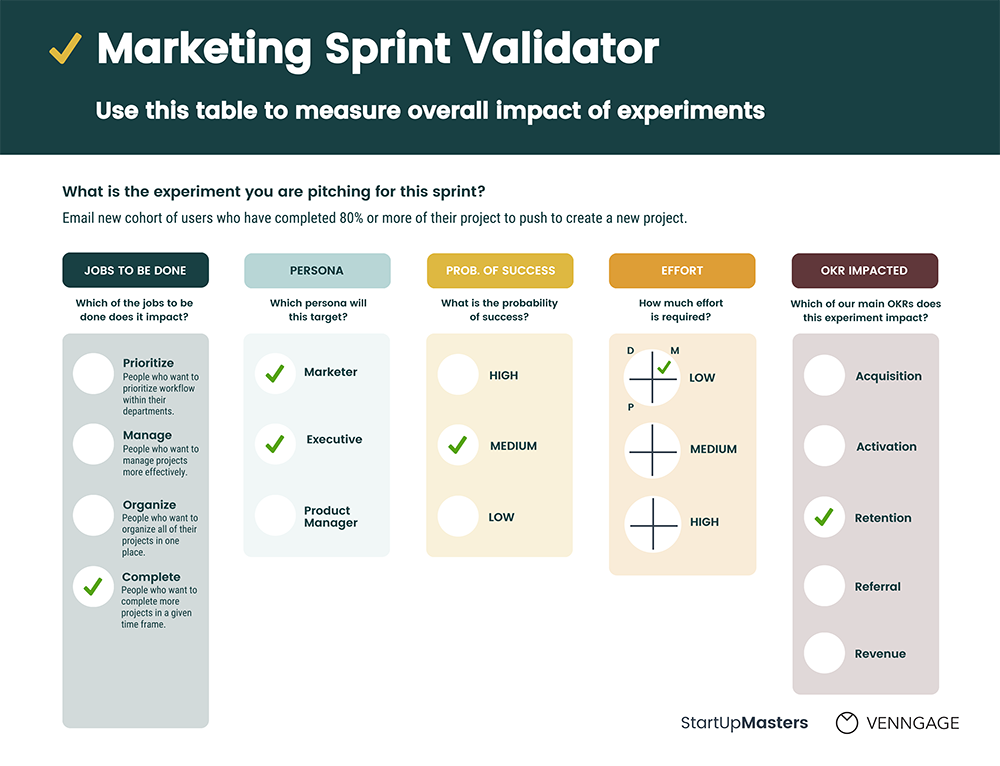
Before you run an experiment, you should validate that it’s an experiment worth running. You can do that by identifying which goal it impacts, what resources the experiment will require, and how much effort you anticipate it will take to run the experiment.
This is the exact marketing sprint validator template that our marketing team uses when we schedule growth experiments:
After you’ve run a growth experiment, it’s extremely important to track your results.
At the end of every sprint, take a good chunk of time to analyze your experiments to see what learnings you can take from them. Then, classify an experiment as a “Winner” or “Loser” based on whether or not the results lined up with your hypothesis.
You can use your results from the sprint that just ended to inform your experiments in the upcoming print.
Here’s an example of a sprint release and results template that you could use. Note how each experiment is owned by a team member to foster accountability for the process and results:

A few growth strategy report best practices:
- Divide your growth strategy reports into color-coded columns based on goals, OKRs, or stages in a sprint
- Use icons like checkmarks and x’s to identify winning experiments and losing experiments
- Include brief descriptions on each template, to make it easy to understand
- Attribute each growth experiment to a team member, to foster accountability for the process and results
- Use your company colors, fonts and logo to maintain consistent branding across all of your communications
9. Market Research
Even after you’ve launched your business, it’s a good idea to do regular market research. You can use your research to plan and refine your marketing strategies, to identify new prospective customers and product plan.
Market research generally involves gathering information about the needs, problems and wants of your customers. This research can help you come up with your customer personas and specific problems you want to solve with your product or service.
You can conduct market research in two ways:
- Qualitative research (calls, focus groups)
- Survey research
For example, many consultants struggle to get buy-in from various stakeholders. The boss may be constantly changing the scope of the project based on a whim, such as the latest article he’s scoured from the internet! Employees may be set in their ways and resistant to incorporate consultants into their workflow.
One way to get clients on board and build trust is to provide stats and research that support your recommendations.
Here’s a market research business report example that lays out the industry landscape and gives clear guidance on the way forward, all backed up by facts.

This cheerful, icon-heavy market research report should help energize reluctant stakeholders. Packaging new (and sometimes daunting) information in fresh ways can help break through resistance.

You may also want to look at competitor statistics and industry trends. This template includes a competitor case study, including website analytics, and a SWOT analysis:

When it comes to creating your market research report, you may want to do an in-depth overview of all of your market research. Or you may want to focus on one area of your research, such as your survey results.
Survey Report
This survey report template helps visualize your findings; the pictogram and chart make the findings easy to understand.
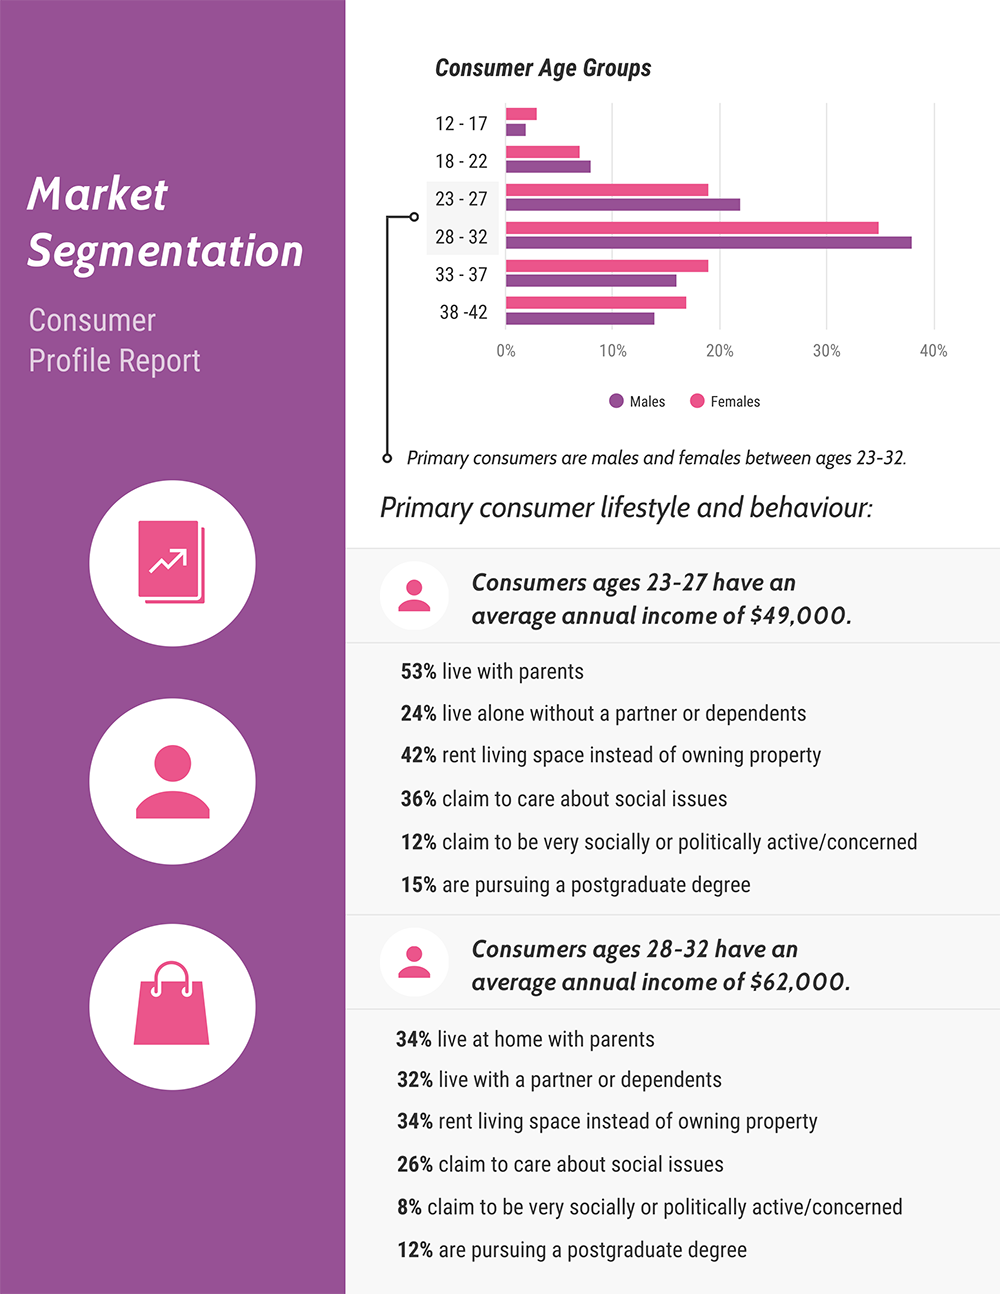
The one-slide market research report identifies the demographics of the survey participants. The report categorizes participants by their jobs, locations, and the topics that they find most engaging. Note how each persona is visualized using an icon:

This business report example highlights how you can give your team and stakeholders a quick overview of your main market and what topics they’re interested in.
One of the purposes of a market research report is to present any conclusions that you came to after analyzing the data.
These could be conclusions about who your target customers are, areas where you can expand your business, and customer needs that aren’t currently being met. The below business report example visualizes this data and also provides space to draw your own conclusions.

Here’s an example of a market research report template that emphasizes key findings in the larger text before providing supporting data:
A few market research report best practices:
- Use icons to illustrate your customer personas
- Use charts and graphs to compare demographic information like customer age, gender, location, and occupations
- Include the main conclusions you came from after analyzing your data
- If your market research report is long enough, include a table of contents
- Include a brief summary of your data collection methods, including the sample size
10. White Paper
White papers are great tools to educate and persuade stakeholders. Consultants can also use them to improve their reputation vis-a-vis big consulting firms and boutique firms or use them as lead magnets in Facebook ads etc.
As always, a polished design is much more likely to engage senior leaders or potential clients.
A business report template or consulting report template is the fastest way to produce something that’s both attractive and easy to understand.
The below consulting report example has a full page dedicated to visuals. It’s the perfect way to break up the text and let it breathe. It also reinforces the information.

Browse our library of thousands of professional images and stock photos to elevate your design or upload your own.
Our editor makes it simple to adapt any of our business and consulting report templates to your needs. Change the text, fonts, photos, icons, colors, anything you want.
The next business report template is perfect for marketers and marketing consultants. It has an inviting and fun (but still professional) cover page that quickly communicates the content marketing process using icons.

Venngage has an extensive library of thousands of custom, modern and diverse icons you can swap into the above consulting report example. For instance, you could add the Twitter or Facebook logo or a “thumbs up” icon.
Then, click on the template’s chart or graph (pages four and five) to add your own data.
Struggling with organizing information in your reports? It’s important for consultants and marketers to find a way to communicate key takeaways, and not overwhelm your reader with data.
The below consulting report template uses filled text boxes and icons on the third page to highlight top findings.

Different-colored headers also help create a hierarchy of information and add more variety to the design.
A few white paper best practices:
- Create an eye-catching white paper cover page using a background in bold color, photos or icons.
- Add a key takeaways section, with a header and bullet points.
- Visualize data using charts and pictograms in order to highlight key data.
- Incorporate your branding into your white paper template (brand colors and logo).
Related: Our blog post with 20+ white paper examples for even more templates and design tips.
11. Project Plan
A project plan is the best way to keep a project on track.
But, showcasing the steps towards completing a project and showing how each step is actionable and measurable can be tough.
This is especially difficult if you’re a consultant and you don’t have company templates to rely on.
The below project plan template is a simple way to visualize what needs to happen, and when.

The above highly organized project plan template uses bar graphs, icons and color-coding to present information in an accessible way. Once you enter the editor, click on the bar graph to customize the schedule.
The project timeline below also uses icons and color-coding to organize information, though in a slightly different way.
Projects suffer when there’s confusion about deadlines and what’s required at each step. This timeline from a business report sample makes it crystal clear what tasks belong to what step and how long each step should take.

A timeline is a perfect way for your team or client to refer back to the project schedule without having to read through tons of text.
You can also revise your timeline as the project progresses to reflect changes in the schedule.
The below consulting report template has a more traditional format for a project plan. Still, like the timelines, this business report sample relies heavily on visuals to create an easily scannable and understandable project overview.

Scope creep is the enemy of any project’s success (and the bane of many consultant’s existence). That’s why it’s so important to define the project from the very beginning. The consulting report template above has a section to do just that.
Of course, projects change and evolve. The project report below will help you raise any issues as soon as they happen and present solutions. That way, stakeholders can make a decision before the project schedule is seriously derailed.

Check out our blog post with 15+ project plan templates for even more examples and design tips.
A few project plan best practices:
- Plot your project schedule visually using a timeline.
- Use color to categorize tasks and milestones.
- Use icons to illustrate steps in a process.
- Insert charts to track the duration of each phase of a project.
- Pick a flexible template that you can update as the project progresses and things change.
Related: Our post on the four phases of the project life cycle.
12. Business Proposal
A business proposal is a document that presents your product or service as the solution to a client’s problem. The goal of a business proposal is to persuade a prospective client to buy your product or service. These proposals can be either solicited or unsolicited.
The contents of a business proposal report will vary depending on the problem.
Typically, a business proposal will include these sections:
- Information about your company (mission, qualifications, competitive edge)
- A detailed description of your client’s problem
- The cost of your product/service
- The methodology of how you propose to solve the client’s problem
- A timeline of your approach to solving the problem
A few business report examples and design tips:
Create an engaging title page for your business proposal. Think of it as the cover of a book or a movie poster. This will be your prospective client’s first impression of your business.
Use a design that tells a story about your company’s mission and the people you serve. For example, the cover for this business proposal template shows a happy team working together:

Meanwhile, this simple business proposal example uses icons to illustrate what the company does. The motif is carried throughout the rest of the proposal design:

Use visuals to highlight the emotion behind the problem
Businesses are made up of people, and people are emotionally charged. When identifying the problem, use imagery to highlight the frustration, confusion, or dissatisfaction behind the problem. This will show empathy towards the people you’re proposing your solution to.
This business report sample page from a business proposal contrasts one image to illustrate the “problem” with a more cheerful image for the “solution”:

This marketing business proposal uses a variety of visuals like icons, bold typography and photos to tell a story:

Related: Our post on consulting proposal templates or our guide to creating a business proposal.
What are the types of business reports?
Different types of reports cater to various purposes, including monitoring performance, making decisions, and more, offering a range of options beyond standard reports.
1. Informational reports
The primary purpose of informational reports is, well, to inform. These reports provide all the nitty-gritty details of specific aspects of your business without any conclusions or opinions.
Examples include daily sales reports, inventory levels, or even project updates. This is the essential “just the facts, ma’am” type of report you need to stay in the loop.
2. Analytical reports
Analytical reports give you a more in-depth look at the data to help you make decisions. These reports come with all the bells and whistles – charts, graphs, and recommendations based on thorough analysis. Analytical reports are what you whip out when you need to decide whether to invest in a new project, evaluate your marketing efforts, or diagnose challenges within the company. The goal of such a report is to help you make smarter decisions for the growth and development of your business.
3. Summaries & reviews:
If you’re a little short on time and need a quick overview of your business’s performance, summary reports are your best bet. These reports condense the crucial details from other reports at regular intervals (monthly, quarterly, or annually) and present them in a digestible format. For example, you can use dashboard software like Supermetrics or alternatives to pull your metrics from different sources and show them in one place.
4. Research reports
As the name suggests, these in-depth reports dig into specific topics or issues relevant to your business. Research reports are great when exploring new markets, considering new product development, or requiring a detailed evaluation of business practices. These reports act as guides for making major decisions that could significantly impact your company’s direction and success.
5. Progress reports
Let’s say you’ve got a fantastic project idea underway. You’ll need to keep track of every stage of it to ensure it’s smooth sailing ahead. Enter progress reports. They track the achievements, setbacks, and future plans of ongoing projects. These are essential for keeping everyone – from employees to investors – in the loop.
Real life business report examples
Here are a few real-life business report examples across different categories to show how teams structure insights, visualize data and communicate decisions effectively.
1. Annual business report – Airbnb 2023 US economic impact report
Airbnb’s 2023 annual business report offers a clear breakdown of financial performance, strategic initiatives and market shifts. It blends narrative insights with clean data visuals, making complex trends easier to digest.
What to learn: Strong storytelling, transparent metrics and user-friendly data presentation can make even dense financial content engaging.
2. Market research report – Deloitte 2023 global marketing trends report
Deloitte’s marketing trends report digs into consumer behavior, emerging technologies and brand perception. It uses a mix of case studies, survey data and future-facing insights to guide decision-making.
What to learn: Use robust research, clear themes and credible data to strengthen your arguments and support strategic recommendations.
3. Project status report – NASA Artemis program updates
NASA’s Artemis status reports highlight milestones, timelines, risks and next steps for one of the most ambitious space programs. The structure stays concise while still communicating massive amounts of technical information.
What to learn: Keep progress reports focused on goals, updates, challenges and forward-looking action items—stakeholders care about clarity, not jargon.
Starbucks’ sustainability report outlines environmental targets, ethical sourcing initiatives, community programs and performance metrics. It’s visually rich while still grounded in detailed data.
What to learn: Strong sustainability reports balance transparency and visuals, making commitments and results easy for stakeholders to evaluate.
How to create a business report in 6 steps?
Creating a business report can seem daunting, especially if you’ve never done it before. don’t let the word “business” intimidate you – these steps can be used for writing a report in any field!
Step 1: Define the purpose and scope of your report
Know the purpose of your report. Are you aiming to share the results of a project? Analyze performance? Recommend specific actions? Whatever the goal, keep it in mind as you go through the process. Also, consider the scope of your report. Decide what information you’ll be including, as well as what you can leave out.
Example: Let’s say your boss wants a report on your team’s sales performance during the last quarter. Your purpose might be to analyze the numbers and identify trends, areas for improvement, or opportunities for growth.
Step 2: Gather relevant data and information
Now that you know what you’re aiming for, it’s time to gather the information you’ll need. This might involve pulling data from internal systems, interviewing colleagues, or even conducting your research. Remember, the quality of your report depends on the accuracy and relevance of the information you provide, so double-check your sources and make sure you’ve got everything you need.
Example: For our sales performance report, you’ll need to collect data on product sales, individual and team performance, and any factors that may have influenced sales during the quarter.
Step 3: Organize your content
Next up is organizing all that information into a logical and easy-to-follow structure. This will depend on the specific requirements of your report, but some common components are an introduction, executive summary, main body, conclusion, and recommendations. A clear and logical structure helps readers easily understand and follow your report.
Example: In a sales performance report, you might start with an executive summary highlighting sales growth (or declines), outline individual team member’s performance, and then delve into a more detailed analysis of factors and trends.
Step 4: Write the report
When writing your report, start by developing a clear and concise writing style, avoiding jargon and buzzwords. Keep your audience in mind – make sure your report is easily digestible for your intended readers.
Example: When writing about sales performance, share facts and figures in simple terms that everyone can understand. Instead of saying, “Our sales team demonstrated a 12.3% compound annual growth rate,” say, “Our sales team increased their sales by 12.3% each year.”
Step 5: Add visual aids
To make your report more engaging and easier to understand, consider adding visual aids like graphs, charts, or images. These can help break up large blocks of text and highlight key findings or trends.
Example: For your sales performance report, you might create a bar chart showing sales growth over time or a pie chart displaying individual team members’ contributions.
Step 6: Review and refine
Last but not least, review your report. Does it achieve the purpose you set at the beginning? Are there any gaps in the information? Are there areas that could be clearer or more concise? Address any issues you find and refine your report until it meets your goals and is easy to understand for your target audience.
Example: In your sales performance report, if you find that you haven’t adequately explored the impact of a new product launch on sales, go back and add that analysis to provide a more comprehensive view.
FAQs on business report
1. What are the best practices for creating a business report?
You could jot down metrics in a Google Doc, add some analysis, and send it off—but is that really effective?
Plain reports often go unread and won’t impress stakeholders. To stand out and gain buy-in, make your reports engaging. Use visuals to simplify data, highlight insights, and capture attention.

You can do that easily by getting started with a business report template or consulting report template.
There are two big reasons why it’s a good idea to create a highly visual business report:
- You will be able to organize, analyze and summarize your findings.
- You will be able to communicate your reports more effectively with your team, stakeholders and customers.
For example, the below business report template shows four different ways you can visualize information. It’s much more captivating and easily digested than a block of text.
Designing a business report doesn’t have to be time-consuming. With a solid template, you can easily customize and repurpose it to fit your needs.
Use charts to turn complex data into clear visuals, making your report more engaging and easy to understand at a glance.
To create an effective business report, start by incorporating your branding. Adding your logo, colors, and fonts ensures consistency, and with Venngage’s My Brand Kit, you can apply your brand elements instantly.
Keep your content clear by focusing on one topic per page or slide—too much text can overwhelm readers. If needed, break up information across multiple pages or find ways to summarize key points.
Functionality should always come first, so use icons, font variations, and colors to emphasize important details without making the design cluttered.
For a simple and professional way to create reports, Venngage is the ultimate tool. It offers easy-to-use templates, visual elements, and branding features to help you design reports that impress. Try it now!
More business communication guides:


